My hypothesis: the internet killed the superstar
Video killed the radio star. And the internet killed the superstar. At least that’s my theory I want to put to the test.
My father grew up in the eras of Michael Jackson and AC/DC. My father’s father grew up with Elvis Presley and The Beatles. My generation’s most popular artists are the likes of Taylor Swift and BTS.
These newer artists are undeniably popular, but they seem to pale in comparison to the popularity of earlier artists.
Let’s see if the data backs up my intuition.
My Approach (skip this section if you just want the answers)
What is a superstar?
Before we begin, we should define ‘superstar’. For this analysis, I am specifically talking about musical artists. Famous actors, athletes, and other celebrities are interesting, but not the subject of this article.
A ‘superstar’ can mean different things to different people—a certain attitude, prevalence in the media, critically acclaimed, a personal affinity—but I think the definition for a ‘superstar’ in music should be based primarily on the popularity of their music.
Of course, the most popular artists are not always the ‘best’ or most ‘important’ artists so take this article with a grain of salt like you should for most things, especially if found on the internet.
How do we actually measure ‘popularity’?
There are many ways to measure popularity, but I think adding up albums sales and song streams is the simplest and most fair way to compare artists (merchandise and ticket sales data are not readily available, awards and media coverage are not always (ever?) representative of public opinion).
However, there is a major issue with this approach that needs to be accounted for…album sales and song streams are very different units of measurement, both in terms of quantity and cost (streaming an album’s worth of songs is cheaper than buying an album). To compare different artists from different eras of music consumption we will need to find a way to convert song streams and sales into albums (or vice versa). Thankfully such a conversion already exists and is more-or-less an accepted industry standard known as ‘equivalent album units’ (EAQ). This is how Billboard does it:
| Consumption Format | Type | Conversion Factor (# of Albums) | Album Equivalency (# of units) |
| Album (digital or physical) | Paid | 1.0 | 1 |
| Physical Single | Paid | 0.1 | 10 |
| Digital Single | Paid | 0.1 | 10 |
| Audio song streams (e.g. Spotify) | Paid | 0.0008 | 1,250 |
| Audio song streams (e.g. Spotify) | Ad Supported | 0.000267 | 3,745 |
| Audio song streams (e.g. Pandora) | Programmed | 0.0004 | 2,500 |
| Video song streams (e.g. YouTube) | Ad Supported | 0.000267 | 3,745 |
There’s a lot of information here, but the most important thing to note it takes a s#!@ ton of song streams to equal an album sale (1,250 to be precise).
This may seem ludicrous at first, but a quick example makes it seem more reasonable:
The average Spotify user listens to 25 hours of content per month and the average song length is 3 minutes and 20 seconds so the average Spotify user listens to 455 songs per month. Spotify Premium costs $10/month thus the cost per song for an average user is $0.02 (!!)

Album prices vary pretty significantly, but let’s assume a price of $16 for this example. The number of streams (at a cost of $0.02) to equal the purchase a $16 would be 800.
Yet Billboard says it takes 1,250 streams to equal the purchase of an album…

Obviously those two numbers aren’t equal and are perhaps significantly different. I think there are two reasons for this. Firstly, my assumptions are scraped from the internet and almost certainly different than reality. Secondly and more importantly, Billboard seems to calculate how many streams are required for an artist to receive the same profit as they would for an album sale. This doesn’t make conceptual sense because we are interested in how much consumers spend on music—not how much profit artists make from music—but Billboard isn’t in the business of being theoretically sound…
Anyways, the point is that it costs far less to listen to a song today than in the past and we need to adjust for that because at the end of the day money talks. Although I have doubts about the industry standard adjustment, I also have doubts in my ability to make a better adjustment with my limited knowledge of the industry so we will use the industry standard adjustments for this analysis.
Now should be able to fairly compare someone like the Beatles (predominantly physical sales) to Post Malone (predominantly streams). All we need is the data!
Where can we get the data?
Well, I have some good news and some bad news. The good news is that Billboard compiles physical sales and stream data to make the ‘Hot 100’ and other lists. The bad news is that the data sits behind a paywall and it’s unclear if this data even includes historical records…
Luckily in searching for the data I found a data a potential alternative: ChartMasters. ChartMasters offers not only FREE access to sales and streaming data, but they also claim to provide BETTER data. They point out that while Billboard may be the industry standard, it has some issues. Mainly:
- Physical sales are estimated based on sales at a sample of retailers. They claim for certain albums Billboard’s methodology led to significant misestimates
- Compilations and greatest hits albums should have sales and streams attributed back to the albums where the songs originally appeared (since that is what ultimately created the value)
- Valuing sales of physical singles as much as digital singles (when physical singles cost significantly more money)
- Not counting music video sales toward album sales (this is a big deal for some artists)
- Lists have been US-focused (although they launched global lists in 2019)
While ChartMasters’ formula to calculate Equivalent Album Sales is quite clear, they are a bit vague on where their raw data comes from and what they do with it. It seems like RIAA shipment data is a major data source, but their methodology to convert a subset of shipments to global sales is unclear. It’s also unclear where digital sales come from (although I suspect it comes directly from iTunes, Google Play, Amazon, etc.). International sales seem to be a complete mess (understandably). In general, I get the sense that determining album sales is a bit like building a Frankenstein out of whatever parts (data) is available, which varies tremendously by era of music consumption.
This lack of transparency is certainly a cause for concern, but it doesn’t necessarily mean the data is wrong. It does however raise the question…
Can we trust the data? Spoiler: probably (we also have no choice)
ChartMasters’ approach sounds good in theory, but does it make sense in practice?
To test let’s see how ChartMasters ranked Billboard’s Top 10 Albums of All Time:
| Album | Artist | Billboard Ranking | ChartMasters Ranking | Top 10 Overlap |
| 21 | Adele | 1 | 18 | No |
| The Sound of Music | Soundtrack | 2 | Not Analyzed | N/A |
| Thriller | Michael Jackson | 3 | 1 | Yes |
| Fearless | Taylor Swift | 4 | 179 | No |
| Born in the U.S.A. | Bruce Springsteen | 5 | 16 | No |
| Ropin’ the Wind | Garth Brooks | 6 | 145 | No |
| Jagged Little Pill | Alanis Morissette | 7 | 26 | No |
| Doctor Zhivago | Soundtrack | 8 | Not Analyzed | N/A |
| All the Right Reasons | Nickelback | 9 | 182 | No |
| Tapestry | Carole King | 10 | Not Analyzed | N/A |
Oof. There is only overlap of one album. Let’s investigate a bit more before condemning ChartMasters:
- ChartMasters has Adele’s 21 ranked at 18, but all albums ahead of her are from a different era so this seems related to methodology. ChartMasters and Billboard both agree that 21 is the most successful modern album
- The difference in rankings between Born in the U.S.A. and Jagged Little Pill is not that large
- It is unfortunate that 3 of the top 10 albums were not analyzed by ChartMasters, but this is a manual process and labor of love so it is understandable
Normally I would like to investigate the discrepancies A LOT more but this is not possible without paying for Billboard Pro and even then it may still be impossible.
Anyways, these differences make me a bit hesitant to use ChartMasters, but these difference does not necessarily mean ChartMasters is wrong. In general, I believe if people are doing tons of work for free, it’s probably for a good reason.
Additionally, it should be noted that while Billboard is the most popular music consumption aggregator, they are not the definitive aggregator. RIAA does its own thing and is widely known as the organization that certifies albums and singles as gold or platinum (note the text at the very bottom of the picture).

Also, there is no viable alternative so we have to use ChartMasters’ data (or stop the analysis here, which is no fun!) 😊
How I used the data
I am curious about how popularity of artists from different eras so time is something I need to factor in. I used Wikipedia to lookup the release year for each album and added it to the data. I did this ‘only’ for the Top 500 albums since I am interested in the most popular artists (and also do not have the time to do more). Obviously, not all sales and streams happen in the year an album was released, but I think attributing 100% of the impact to the release year is defensible (there also isn’t a viable alternative).
To be clear, since we are ignoring albums outside of the Top 500 we will NOT be able to answer questions such as ‘who are the most successful artists of all time’, ‘average album sales by decade’, and many other interesting questions because that would require having data on albums outside of the Top 500.
However, we will be able to answer my initial question: ‘are artists less popular after the adoption of the internet?’
Results
The most popular internet-era artists are not as popular as the most popular artists in the 1970’s, 1980s, and 1990s
There was (and the data suggests there never will be) an album bigger than Michael Jackson’s Thriller. In fact, Thriller sold 66% more than the second-best album of all-time, which is staggering and perhaps incomprehensible to someone who didn’t experience the phenomenon directly…he is a superstar among superstars. ‘King of Pop’ seems like too modest of a title…
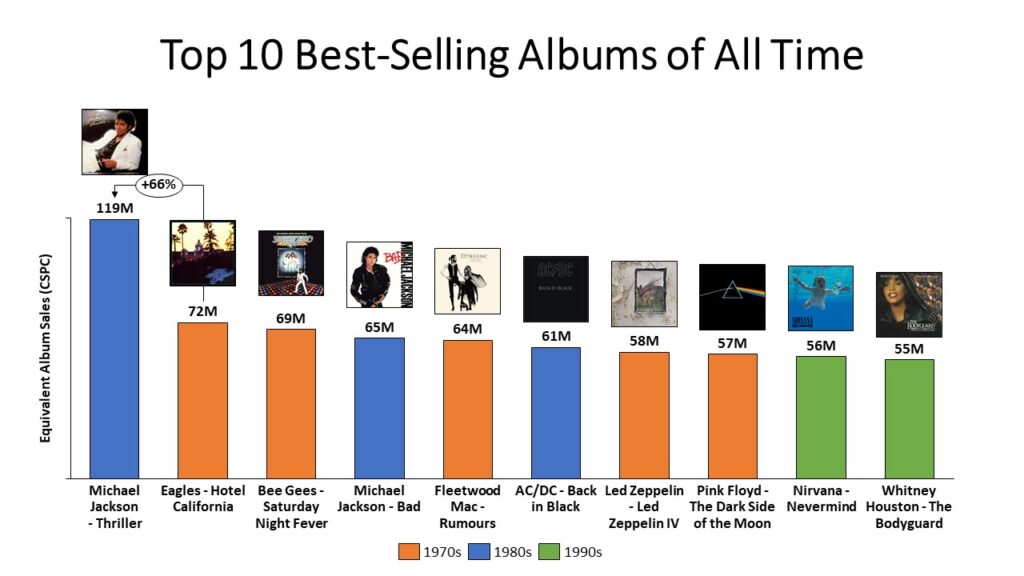
Two other interesting things to note are:
- Michael Jackson is the only artist with 2 albums in the Top 10
- There are no albums from the 2000s, 2010s (or any time before 1970).
Okay, let’s zoom out a bit. Michael Jackson was an example meant to illuminate a trend: a decrease in the # and sales of Top 500 albums since the advent of the internet. This appears to be true:

Not only are there less Top 500 albums in the era of digital music distribution, the Top 500 albums post-2000 are less big than their pre-internet counterparts.
Open and shut case, right? Not quite…something interesting happens if we look at the biggest album for each year instead of each decade…
The peak popularity of artists appears to have ended in the mid-1980s, well before the adoption of the internet…

The internet may have exacerbated the death of the superstar, but it is clearly not the sole or even primary culprit…
Further Investigation
What did kill the superstar?
The simplest answer would be that the popularity of superstars declined because the music industry as a whole was struggling, but that’s not the case, at least when the decline of superstars began in the mid-1980s.

In fact, music sales increased during the mid-1980s and all of the 1990s. Simple logic dictates that if industry revenue is constant (or slightly up) and the most popular albums are selling less, then sales must be distributed more evenly and/or distributed more widely.
But that doesn’t answer the question, it simply introduces another: why did music sales fragment?
Radio killed the superstar?
We are now firmly entering the territory of conjecture and correlation vs causation, but I believe the simplest and most compelling explanation for the fragmentation in music consumption is the proliferation of radio stations, specifically niche, non-top-40 music-playing radio stations.

Technological innovation—the creation of the sonically superior FM radio band—made new broadcasts possible. Government regulation—requiring FM stations have no more than 50% programming overlap with AM stations—dictated the new broadcasts be something substantially different than the predominant Top 40 music stations and talk shows. And Capitalism rewarded business for experimenting with niche musical programming, to which consumers responded favorably.
Unfortunately, this chart does not speak directly to growth in music-playing radio stations (only the total number), however, there are a few clues that suggest the impact on the music industry lagged behind the growth of radio stations and was not prominently felt until the early 1980s (when we see peak album popularity).
Firstly, a ton of new genres became popular in the 1980s such as electronic dance music (EDM), new wave, soft rock, glam metal, thrash metal, shred guitar, R&B, hip hop, and numerous others. Secondly, industry insiders were commenting on the change like Billboard columnist Mike Harrison who noted in 1981:
“No longer is there an exclusive Top 40 anything, but rather an ever-changing multitude of Top 40’s, depending upon the genre…Those who enjoy a-little-bit-of-this-and-a-little-bit-of-that…constitute a minority.”
Why this is so important is because before the internet, radio was the primary way people discovered and listened to music. The proliferation of radio stations helped grow the music industry as a whole by catering to a broader set of increasingly niche tastes, but it also fragmented the mass audience enjoyed by superstars pre-1980s.
Of course, some of you will point out that the biggest superstar of all, Michael Jackson, exploded onto the scene in 1982, after the death of the mass radio audience. Michael Jackson’s success, however, can be largely attributed to his embrace of a new medium: television, specifically music videos. There’s a lot to say on this subject, but this article does an excellent job highlighting how revolutionary the music videos from Thriller were.
If my emphasis on media channels to explain fragmentation in musical tastes is mostly correct, the power of radio (and music videos) helps us understand why the internet—and the ability to discover an essentially endless supply of music at little to no cost—had such a drastic effect on the music industry.
An alternative explanation, and one favored by my uncle, is that music was less good after the 1970s, which is coincidentally when my uncle became an adult and stopped listening to new music so I don’t find this argument very compelling…
If we want to continue the ‘what medium killed the superstar’ metaphor, I’d say radio put the superstar on life support and the internet finished the job.
Accessories to murder
That said, while media channels were likely the most significant driver of fragmentation (and the death of superstars), another critical component was surely the adoption of digital recording which unlocked the use of synthesizers and all sorts of non-traditional instruments.
Amazingly we have not run out of new and compelling ways to make songs using traditional instruments, however, new instruments opened up entirely new genres that consumers embraced at the expense of existing genres and mass appeal.
Beyond the verdict–what does it all mean?
Firstly, it supports my hypothesis that superstars were less super in the internet era. Gen Z, Millennials, and even some Gen Xers have not experienced anything near the level of mania that occurred in the 1970s, 1980s and early 1990s (they have not experienced anything like Elvis and The Beatles as well, but this methodology likely doesn’t do them justice). They especially have not experienced anything like Thriller, which was an unparalleled cultural phenomenon (everything I’ve consumed on Michael Jackson falls short (naturally) of conveying the full breadth and intensity of the phenomenon, but this article, this article, and this video give you some interesting glimpses).
Secondly (and to my surprise), superstars were more less super before the internet due to the proliferation of new radio stations that increasingly catered to niche and new genres of music.
Lastly, consumers have benefited tremendously from these developments (artists have a more complicated relationship). Ultimately fragmentation exists because consumer preferences were not being fully satisfied by a ‘best-of-everything’ Top 40 broadcast and while more choices are not always a good thing (like 40 types of peanut butter at the grocery store or nicotine pens), I think it’s safe to say more types of music is a good thing. Additionally, the cost of consuming music has fallen substantially while the convenience of listening has increased dramatically (it’s pretty amazing to be able to listen to any song ever made on your phone in a matter of seconds).
There is, however, an often-neglected downside for consumers that is rarely mentioned. While it is undeniably wonderful to discover and satisfy your unique tastes, there is also value in sharing a passion with others and feeling part of something bigger than yourself. People’s listening habits today do not overlap to the same degree or intensity that they would have when there were fewer choices. Personally, I am envious of the world where virtually everyone was a die-hard Michael Jackson fan (or a fan of Nirvana, Led Zepplin, etc.) It’s not uncommon for me to try to talk to someone about music and have little-to-no tastes in common.
At the end of the day, I think the benefits of fragmentation vastly outweigh the costs—no one is forcing people to not all listen to the same album after all—but it is a drawback worth noting.
That’s all folks! The dataset is relatively limited, but if you have any additional analysis you’d like to see, let me know! Also, you can find the full list of the Top 500 albums here.
Bonus: what else does the data say? (finally, The Beatles show up!)
There are a lot of fun nuggets in this data:
- 144 artists account for all Top 500 albums (80% of artists with a Top 500 album have multiple Top 500 albums)
- 1991 was a monster year for music and had 17 Top 500 albums released, including 2 Top 500 albums from Gun N’ Roses
- Santana had the largest gap between albums appearing in the Top 500 at 30 years (1969 vs 1999)
- Queen and The Beatles are tied for the most Top 500 albums of all time at 12 a piece (Led Zepplin is the only artist to be on the list of top 10 albums and most top 500 albums)
